AMD 2nd-Gen Ryzen vs Intel Coffee Lake IPC Comparison
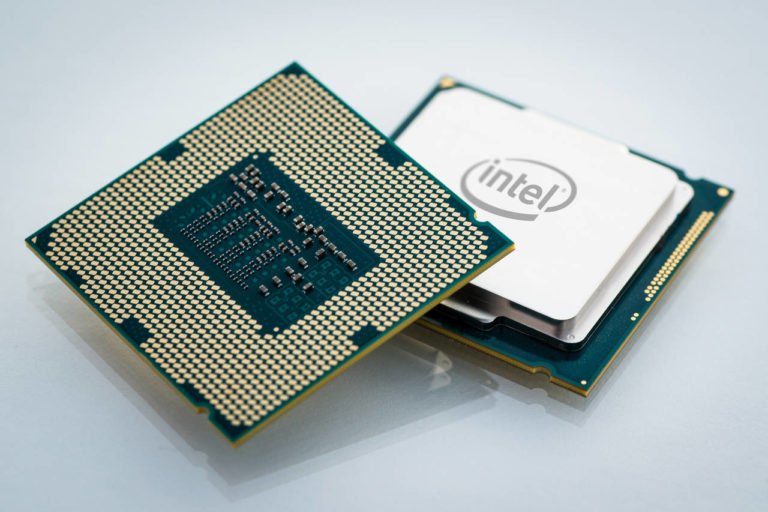
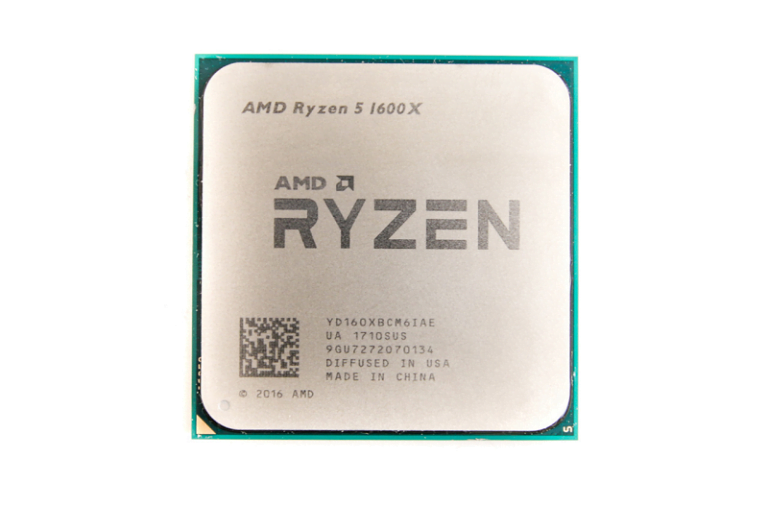
We know that AMD trails when it comes to frequency, but with the new Zen architecture, the company appears to have improved its IPC performance significantly. To see how big is the gain, we compare AMD’s 2nd-gen Ryzen CPUs with Intel’s 8th-gen Coffee Lake CPUs, all running at the same clock speed.
For those of you unaware, IPC stands for Instructions per cycle and it’s a good indicator of a CPU performance. It basically refers to the number of calculations a CPU can perform per clock cycle. Meaning, if two CPUs have the same IPC, they will offer the same performance at the same frequency.
Benchmarks show that AMD’s IPC performance is on par with that of Intel. In fact, the Ryzen 2000 series CPUs often surpass their Intel rivals in rendering applications. Sadly though, team red still suffers from lower gaming performance, which isn’t the result of clock speed deficit but the way Infinity Fabric connects Ryzen’s CCX modules.
For detailed analysis, below are the benchmark results. We compare a number of Ryzen and Coffee Lake chips on gaming, productivity and power consumption fronts, but more specifically, it’s a Ryzen 5 2600X vs Core i7-8700K battle. So without further ado, let’s get started.
AMD 2nd-Gen Ryzen vs Intel Core i7-8700K – Clock-for-Clock Benchmark
Our friend Steve at Hardware Unboxed recently conducted various tests to see how much IPC gains team red has achieved with their second-gen Ryzen CPUs. For this purpose, he neutralized as many variables as he could. For example, he disabled any type of boost technology and locked all of the CPU cores at 4GHz.
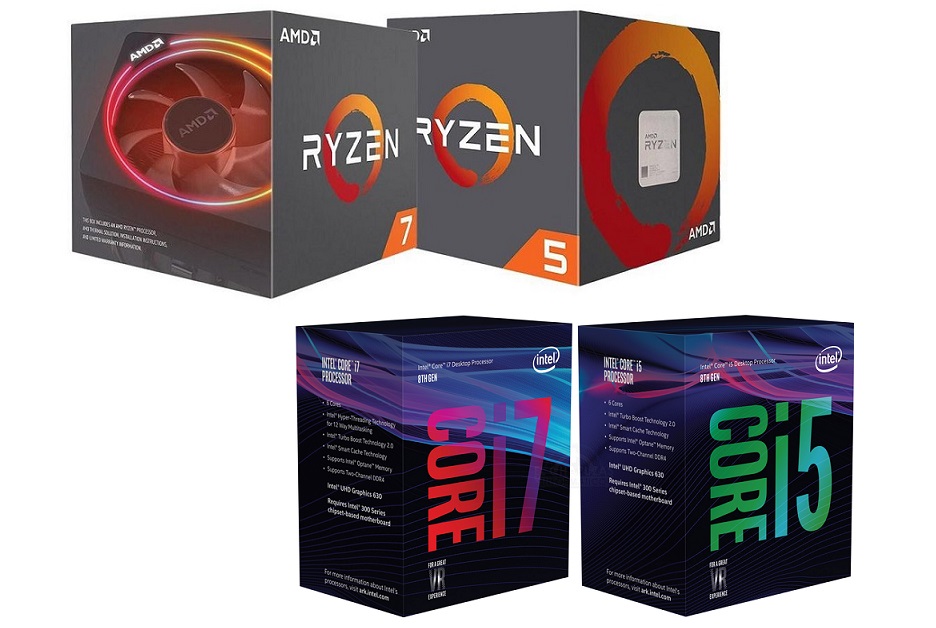
The test included results for the Intel Core i7-8700K, Core i5-8600K, Ryzen 7 2700X, Ryzen 5 2600X and Ryzen 7 1800X along with the 1600X. As for CPU resources, the Ryzen 7 2700X and 1800X are both 8-core, 16-thread CPUs while the Ryzen 5 2600X, 1600X and Core i7-8700K all have 6 cores and 12 threads. The 6-core 8600K is at disadvantage here as it doesn’t support hyper-threading.
The Ryzen 2000 series CPUs were tested on the ASRock X470 Taichi Ultimate and the Coffee Lake CPUs on the ASRock Z370 Taichi motherboard. Other systems specs include the MSI GTX 1080 Ti Gaming X Trio and G.Skill FlareX DDR4-3200 MHz memory for both configurations.
Productivity Performance
Starting with the SiSoftware Sandra test, Intel’s Coffee Lake CPUs manage to reach a bandwidth of around 33GB/s. Meanwhile, the first and second-gen Ryzen chips are similar with a bandwidth of 39GB/s, which is a 15% increase when compared to the rival i7-8700K.
| SiSoftware Sandra 2016 (GB/s) | |
|---|---|
| Intel Core i7-8700K @ 4.0GHz | 33.1 |
| Intel Core i5-8600K @ 4.0GHz | 32.8 |
| AMD Ryzen 7 2700X @ 4.0GHz | 39.5 |
| AMD Ryzen 5 2600X @ 4.0GHz | 39.4 |
| AMD Ryzen 7 1800X @ 4.0GHz | 39.4 |
| AMD Ryzen 5 1600X @ 4.0GHz | 39.1 |
Moving to Cinebench R15, the Ryzen 5 2600X outperforms the predecessor 1600X in both multi-threaded and single thread tests by 4% and 3% respectively. The 2600X is also 4% faster than the 8700K in the multi-threaded test but 4% slower when it comes to the single thread performance. As expected, the clock-for-clock octa-core Ryzen CPUs easily surpass the 8700K in the multi-threaded test.
| Cinebench R15 (Multi-thread / Single Thread) | |
|---|---|
| Intel Core i7-8700K @ 4.0GHz | 1325 / 174 |
| Intel Core i5-8600K @ 4.0GHz | 988 / 174 |
| AMD Ryzen 7 2700X @ 4.0GHz | 1816 / 168 |
| AMD Ryzen 5 2600X @ 4.0GHz | 1384 / 168 |
| AMD Ryzen 7 1800X @ 4.0GHz | 1755 / 164 |
| AMD Ryzen 5 1600X @ 4.0GHz | 1326 / 163 |
Next up we have the PCMark 10 video editing test. Here, the 2600X scores 10% higher than the 1600X, matching Intel in terms of IPC performance.
| PCMark 10 (Video Editing) | |
|---|---|
| Intel Core i7-8700K @ 4.0GHz | 5399 |
| Intel Core i5-8600K @ 4.0GHz | 5429 |
| AMD Ryzen 7 2700X @ 4.0GHz | 5432 |
| AMD Ryzen 5 2600X @ 4.0GHz | 5438 |
| AMD Ryzen 7 1800X @ 4.0GHz | 5341 |
| AMD Ryzen 5 1600X @ 4.0GHz | 4952 |
When maxed out in the physics test, SMT appears more efficient than Intel’s HT technology. Even the 1600X outperforms the 8700K by around 3.5% while the 2600X is 8% faster.
| PCMark 10 (Physics) | |
|---|---|
| Intel Core i7-8700K @ 4.0GHz | 17281 |
| Intel Core i5-8600K @ 4.0GHz | 12887 |
| AMD Ryzen 7 2700X @ 4.0GHz | 21766 |
| AMD Ryzen 5 2600X @ 4.0GHz | 18661 |
| AMD Ryzen 7 1800X @ 4.0GHz | 21156 |
| AMD Ryzen 5 1600X @ 4.0GHz | 17911 |
Gaming Benchmarks
It’s time for some gaming benchmarks and this is where things get a little iffy for AMD. Keep in mind that all games are tested at 1080p resolution using the GTX 1080 Ti.
AotS: Escalation [DX12] – 1080p [High Quality]
When matched clock for clock, the Ryzen 5 2600X offers an 8% better performance than the 1600X in Ashes of the Singularity, but it’s still a whopping 11% slower than Intel’s current flagship CPU. This margin reaches over 20% at times when we take into account the fact that Intel CPUs clock much higher than AMD Ryzen.
| Avg. Frame Rate / 1% [Min FPS] | |
|---|---|
| Intel Core i7-8700K @ 4.0GHz | 126 / 110 |
| Intel Core i5-8600K @ 4.0GHz | 112 / 100 |
| AMD Ryzen 7 2700X @ 4.0GHz | 123 / 106 |
| AMD Ryzen 5 2600X @ 4.0GHz | 112 / 98 |
| AMD Ryzen 7 1800X @ 4.0GHz | 120 / 103 |
| AMD Ryzen 5 1600X @ 4.0GHz | 104 / 93 |
Assassin’s Creed: Origins – 1080p [Ultra Quality]
Moving to Assassin’s Creed Origins, we see the 2600X being a mere 2% faster than the 1600X while the 8700K is more than 14% ahead.
| Avg. Frame Rate / 1% [Min FPS] | |
|---|---|
| Intel Core i7-8700K @ 4.0GHz | 103 / 76 |
| Intel Core i5-8600K @ 4.0GHz | 103 / 75 |
| AMD Ryzen 7 2700X @ 4.0GHz | 99 / 71 |
| AMD Ryzen 5 2600X @ 4.0GHz | 90 / 64 |
| AMD Ryzen 7 1800X @ 4.0GHz | 97 / 70 |
| AMD Ryzen 5 1600X @ 4.0GHz | 88 / 63 |
Assassin’s Creed: Origins – 1080p [High Quality]
The margin is slightly reduced with the high quality preset but the 8700K is still 11% ahead of the 2600X.
| Avg. Frame Rate / 1% [Min FPS] | |
|---|---|
| Intel Core i7-8700K @ 4.0GHz | 119 / 87 |
| Intel Core i5-8600K @ 4.0GHz | 118 / 85 |
| AMD Ryzen 7 2700X @ 4.0GHz | 111 / 82 |
| AMD Ryzen 5 2600X @ 4.0GHz | 106 / 78 |
| AMD Ryzen 7 1800X @ 4.0GHz | 109 / 80 |
| AMD Ryzen 5 1600X @ 4.0GHz | 104 / 77 |
Battlefield 1 [DX11] – 1080p [Ultra Quality]
In Battlefield 1 tested at ultra quality preset, the 2600X surpasses its first-gen predecessor by 9% but still 7% slower than the 8700K.
| Avg. Frame Rate / 1% [Min FPS] | |
|---|---|
| Intel Core i7-8700K @ 4.0GHz | 174 / 121 |
| Intel Core i5-8600K @ 4.0GHz | 171 / 117 |
| AMD Ryzen 7 2700X @ 4.0GHz | 167 / 112 |
| AMD Ryzen 5 2600X @ 4.0GHz | 162 / 105 |
| AMD Ryzen 7 1800X @ 4.0GHz | 156 / 104 |
| AMD Ryzen 5 1600X @ 4.0GHz | 148 / 94 |
Battlefield 1 [DX11] – 1080p [Medium Quality]
At medium quality preset, the GTX 1080 Ti stretches its legs a little more and the 2600X is now 10% slower than the 8700X.
| Avg. Frame Rate / 1% [Min FPS] | |
|---|---|
| Intel Core i7-8700K @ 4.0GHz | 209 / 128 |
| Intel Core i5-8600K @ 4.0GHz | 208 / 127 |
| AMD Ryzen 7 2700X @ 4.0GHz | 189 / 118 |
| AMD Ryzen 5 2600X @ 4.0GHz | 184 / 114 |
| AMD Ryzen 7 1800X @ 4.0GHz | 176 / 110 |
| AMD Ryzen 5 1600X @ 4.0GHz | 173 / 108 |
Far Cry 5 [DX11] – 1080p [Ultra Quality]
The 2600X sees a huge improvement in Far Cry 5 where it’s 10% faster than the 1600X, but even then it lags behind the Intel flagship by an 8% margin.
| Avg. Frame Rate / 1% [Min FPS] | |
|---|---|
| Intel Core i7-8700K @ 4.0GHz | 128 / 108 |
| Intel Core i5-8600K @ 4.0GHz | 126 / 107 |
| AMD Ryzen 7 2700X @ 4.0GHz | 121 / 99 |
| AMD Ryzen 5 2600X @ 4.0GHz | 118 / 97 |
| AMD Ryzen 7 1800X @ 4.0GHz | 107 / 90 |
| AMD Ryzen 5 1600X @ 4.0GHz | 107 / 91 |
Power Consumption Comparison
Before we get into power consumption results, I want to mention that this clock-for-clock comparison had many power saving features disabled so it isn’t the most realistic consumption test. In addition, the voltages for Ryzen CPUs were increased above spec to stabilize an all core 4GHz overclock.
With that said, the Ryzen 5 2600X and 1600X systems both consume the exact same amount of power, that is 402W, in Ashes of the Singularity. Meanwhile, the 8700K is rated at 391W which is 3% less power compared to Ryzen CPUs under these test conditions.
| Load (watts) | |
|---|---|
| Intel Core i7-8700K @ 4.0GHz | 391 |
| Intel Core i5-8600K @ 4.0GHz | 375 |
| AMD Ryzen 7 2700X @ 4.0GHz | 413 |
| AMD Ryzen 5 2600X @ 4.0GHz | 402 |
| AMD Ryzen 7 1800X @ 4.0GHz | 421 |
| AMD Ryzen 5 1600X @ 4.0GHz | 402 |
In case of Far Cry 5, power is much the same across the board, with all CPUs consuming around 380W. So it sort of varies from game to game, but in general, the 8700K is more power efficient than Ryzen CPUs.
| Load (watts) | |
|---|---|
| Intel Core i7-8700K @ 4.0GHz | 382 |
| Intel Core i5-8600K @ 4.0GHz | 374 |
| AMD Ryzen 7 2700X @ 4.0GHz | 378 |
| AMD Ryzen 5 2600X @ 4.0GHz | 381 |
| AMD Ryzen 7 1800X @ 4.0GHz | 384 |
| AMD Ryzen 5 1600X @ 4.0GHz | 381 |
Conclusion
What do we get from the above results? First, despite the fact that AMD loses in terms of clock speeds, the Ryzen Gen 2 CPUs are often on par with their Intel rivals for productivity scores at 4GHz clock-for-clock comparison.
Here, in applications such as Cinebench R15, AMD lags a bit in the single-core performance but at the same time, it’s up to 4% faster in multi-threaded test where SMT is well leveraged. Similarly, the Ryzen chips are noteably faster than Intel for the PCMark 10 gaming physics test.
Of course, team red isn’t up to the mark when it comes to gaming. While a few of their fans were hoping most of the lag in gaming performance could be the result of clock speed deficit, the above clock-for-clock benchmarks clearly show that is not the case.
Apparently, for the most part, it comes down to how AMD connects its cores, or rather its CCX modules. When we compare, Intel’s Ring Bus is very low latency and is simply better suited for gaming. We can see this when comparing their own Mesh Interconnect architecture.
The Mesh Interconnect is a superior solution for connecting large amount of cores, like 28 of them for example, but for hexa- or octa-core CPUs, Ring Bus is definitely more efficient. This is why the 8700K beats the Core i7-7800X, 7820X and even the 10-core i9-7900X when it comes to gaming.
Same is the case with AMD’s Infinity Fabric, though the things are a little more complex here. A Ryzen processor is comprised of multiple CCX (CPU Complexes) linked together using the Infinity Fabric interconnect. The cores within a CCX module have a similar core to core latency to that of the 8700K, but once you exit the CCX, that latency increases by a great deal.
So as I’ve said before, the problem is somewhat related to the way Infinity Fabric connects the cores within the AMD Ryzen. The core to core latency is reduced with faster memory as the speed of the IF is tied to the memory clock rate.
It’s also worth mentioning that today’s gaming titles are designed to benefit from just a few cores and that they are almost exclusively optimized for Intel CPUs. With Ryzen’s release though, things are slowly starting to change now so AMD’s gaming performance will improve, just don’t expect it to be surpassing Ring Bus anytime soon.
That being said, team red has certainly closed the gap when it comes to IPC performance. The 2nd-gen Ryzen CPUs offer several benefits over the rival Coffee Lake chips, so definitely worth the money. Let’s see how the battle plays out in the coming months, especially with Intel’s next counter-stroke already on the way.

